
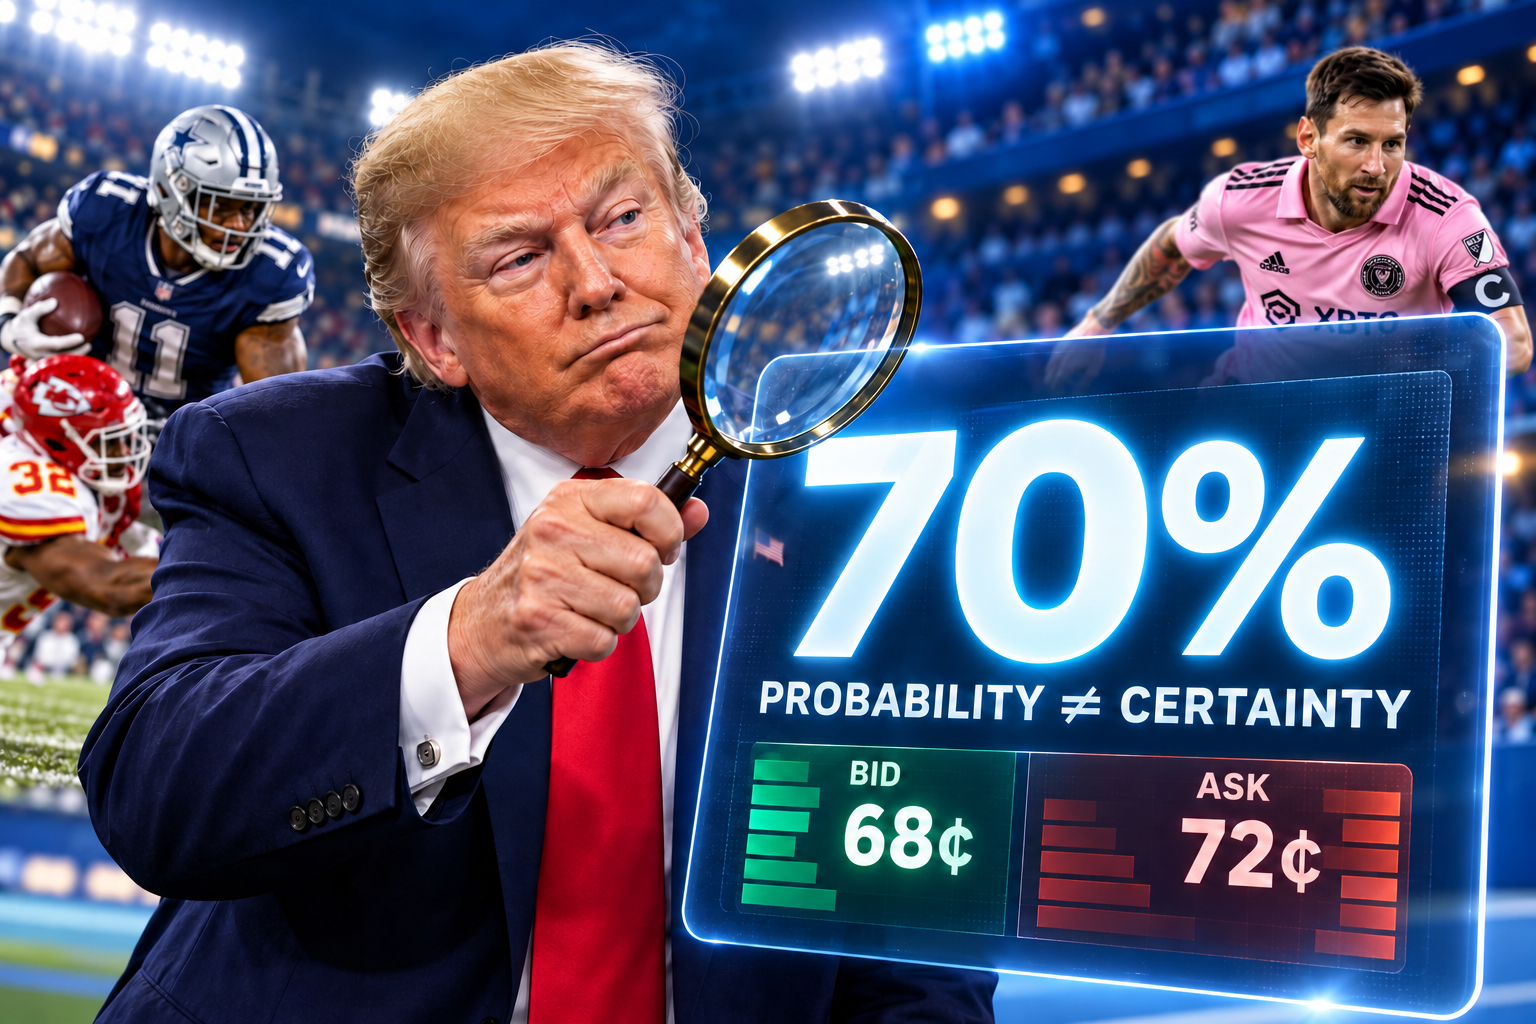
There is something reassuring about a percentage. Say a football team will “probably win” and you sound like someone chatting in a pub. Say it has a 70% chance and suddenly you sound as though you have run several thousand simulations. Prediction markets put these numbers in front of us every day. An election candidate, an NFL favourite, an interest-rate decision: each gets a percentage that moves as people trade. Those prices can contain valuable information. But the precision of the display can make us assume more precision in the underlying knowledge than actually exists. Before treating that 70% as an authoritative forecast, we should ask where it came from—and how well similar forecasts have performed.
What does the number actually represent?
Consider a simple contract that pays $1 if an event happens and nothing if it doesn’t. A price of 70 cents translates into a market-implied probability of 70%. That is a useful interpretation. It does not mean someone has independently established the event’s true probability. The price emerges from trading: what participants are prepared to buy and sell, given their information, incentives and available money. It is not a survey in which every informed person gets an equal vote. Even the number on the screen needs some explanation. Polymarket says its displayed probability normally uses the midpoint between the best buying and selling prices. When that gap exceeds 10 cents, it uses the last traded price instead. Imagine buyers offering 68 cents and sellers asking 72 cents. The screen could show 70%, although an immediate purchase would cost 72 cents, assuming enough contracts were available there. The displayed probability and the price you can actually trade at are different pieces of information.
Money at stake helps. It doesn’t remove uncertainty.
The strongest argument for prediction markets is that being right can pay. Someone who believes a contract is underpriced has a financial reason to buy it. Someone who spots an overreaction can trade against it. That creates a mechanism for information to reach the price. But the mechanism has practical limits. A knowledgeable trader may have little capital. A well-funded participant may have poor information. Several apparently independent traders may be reacting to the same unreliable report. And correcting a price can require tying up money for months. A trader might consider a contract slightly mispriced without finding the potential return attractive enough to act. None of this makes prediction markets useless. It explains why their prices deserve scrutiny alongside our attention.
A 70% favourite losing doesn’t prove the market was wrong
This is where the discussion often falls apart. A market gives an outcome a 70% chance. The other outcome happens. Screenshots circulate, accompanied by declarations that prediction markets have failed. Yet a well-calibrated 70% forecast leaves a substantial chance of the event not happening. The useful question is what happens across a large collection of forecasts. Among events assigned probabilities around 70%, do approximately seven in ten occur? That relationship is called calibration. We should not expect exactly seven successes in every ten events. Small samples fluctuate, and related events can move together. Ten contracts linked to the same election do not provide the same breadth of evidence as ten unrelated contests. One dramatic result tells us much less than a properly constructed track record.
What would a convincing track record look like?
Start by recording probabilities at consistent points before events happen. For sports, that might mean comparing prices 24 hours before the scheduled start, then again one hour before. For longer-running political or economic questions, different fixed horizons would make sense. Keep categories separate. Strong forecasting performance in major sporting events would not automatically establish equal reliability in thinly traded political markets. Publish the sample sizes, explain exclusions and show uncertainty around the results. Include the unremarkable contracts as well as the famous successes. Calibration should also sit alongside measures that reward useful distinctions between outcomes. A forecast that says 50% about everything might be calibrated in a balanced sample, while offering little help identifying which events are more likely. Established forecasting methods already address this. Metaculus, for example, uses a logarithmic scoring rule designed to reward honest probability estimates and penalise confident mistakes. Prediction-market analysis should be comfortable with that level of accountability.
Good forecasting and good betting value are different questions
For BetCompare readers, there is another distinction worth making. Suppose, hypothetically, that an event’s true probability really is 70%. Paying 70 cents for a contract returning $1 on success gives you zero expected profit before costs. Fees would make the expected return negative. A reliable forecast does not automatically create an attractive purchase. You still need to consider the available price, transaction costs, order size and settlement conditions. If you intend to sell before resolution, the price available when you exit matters too. That is why comparing payouts and assessing forecasting quality belong together. One asks whether the probability estimate is trustworthy. The other asks what you are paying for the exposure. Prediction markets deserve to be taken seriously. Their ability to turn competing views into a continuously updated price is valuable. But the industry’s strongest evidence will come from showing how those prices perform over time. When a screen says 70%, the next question should be simple: How often has your 70% actually meant 70%?
Discussion